

Há poucos dias atrás entrei em contato com William Cartwright, Presidente da Associação Internacional de Cartografia,
para comunicar a criação do fórum e convidá-lo a postar e conhecer um pouco do meio cartográfico brasileiro.
Ele me respondeu com um email que continha um anexo relacionado a imagens 3D no SketchUp para visualizacao no
Google Earth .
.
É um artigo muito interessante, postarei aqui para que possamos compartilhá-lo entre nós cartógrafos:
Abstract
Since its launch in 2004, Google Earth has grown to become one of the most popular portals for spatial content on the web.
The intuitive and interactive nature of the application makes it ideal for use as a learning tool for students, particularly those in
the Spatial Sciences. As well as being a medium through which to deliver virtual field trips and media-rich presentations, Google Earth
also presents itself as a blank canvas onto which students can add and edit their own content. Keyhole Markup Language (KML), the
scripting behind Google Earth overlays and placemarks, is an easy language for students to learn and use, and can be introduced as
a follow up to HTML and XML training. With training, Geospatial Science students at RMIT have been able to create packages of information,
navigable in a similar way to which users navigate through Weplb pages. With both Google Earth and its associated 3D modelling software,
Google SketchUp, available for free download, students have been given the opportunity to create their own 3D content that can be uploaded
to the web and viewed remotely. Students are able to use the same software at home as they are at the University, providing opportunities to
develop online courses and, in turn, opening the creation of web based Geo-Visualization products up to a broader audience at university level.
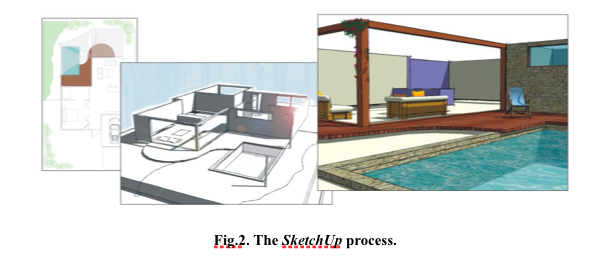
This paper outlines how Google SketchUp has been used in a University context to develop 3D landscape visualisations and looks at the ways
in which Multimedia Cartography students are using Google Earth to visualise project data in ways not previously possible using traditional methods.
Introduction
The aim of a virtual world display is to provide realistic and truthful sensory cues about the real world by replaying stored information or by generating
information. Laurel (1995) has said that the important thing about VR is what it does rather than how its effects are achieved - it permits people to
behave as if they were somewhere they are not. VR transports users to some other place and enhances their perceptions about what they are experiencing
by appealing to several senses at once - sight, hearing and touch. These senses are stimulated by the sensations of force, resistance and texture and it
is predicted by Laurel that smell will eventually become available, and, that as virtual spaces begin taking on a richer, more complex texture, VR will be
the foundation of a major transformation in the ethos of computing. Laurel also sees artists using VR to represent the complexities of experience from
‘synthesthesia’ to emotional experiences, leading to a situation where: “VR may function as a link from the technological manifestations of humanity back
to the world that technology has ostensibly replaced” (Laurel, 1995, p. 70).
One of the key issues for building effective landscape visualizations concerns the sensory realism that is necessary in virtual world displays. How best to
facilitate this has demanded access to and the use of various tools and software packages. These were once expensive and, sometimes, difficult to use
without extensive training and practice. Now, commercial enterprises like Google actively engage users with their visualization software like Google Earth
and provide not just the application to deliver product, but also free, or relatively inexpensive software with which to develop content.
Digital earth and Digital Globes
In an address in 1998, then US Vice-President Al Gore (1998) said: “Now we have an insatiable hunger for knowledge. Yet a great deal of data remains
unused. … part of the problem has to do with the way information is displayed.” “The tools we have most commonly used to interact with data, such as
the “desktop metaphor” employed by the Macintosh and Windows operating systems, are not really suited to this new challenge. I believe we need a
“Digital Earth”. A multi-resolution, three-dimensional representation of the planet, into which we can embed vast quantities of geo-referenced data”.
“A Digital Earth could provide a mechanism for users to navigate and search for geospatial information - and for producers to publish it. The Digital
Earth would be composed of both the "user interface" - a browsable [sic], 3D version of the planet available at various levels of resolution, a rapidly
growing universe of networked geospatial information, and the mechanisms for integrating and displaying information from multiple sources”.
Al Gore’s address on the Digital Earth (Gore 1998) provided information about how this concept might be initially applied: …“In the first stage, we should
focus on integrating the data from multiple sources that we already have. We should also connect our leading children’s museums and science museums
to high-speed networks such as the Next Generation Internet so that children can explore our planet. University researchers would be encouraged to
partner with local schools and museums to enrich the Digital Earth project — possibly by concentrating on local geospatial information.” Gore’s idea
about using the metaphor of ‘Digital Earth’ is now being realised with readily-available products from both governmental and commercial enterprises.
‘Digital Globes’ are being employed to facilitate access to and visualization of geographical information.
According to Riedl (2007), there are three types of Digital Globes:
- Virtual hyperglobes: Visualization of the digital image on a virtual globe body in virtual space;
- Tactile hyperglobes (material hyperglobes): Visualization of the digital image on a physical (touch-sensitive) globe body in real space; and
- Hologlobes: Visualization of the digital image on a virtual globe body in real space.
It is the first type of Digital Globe that this paper focuses on – Virtual hyperglobes.
Products on the market include World Wind, an open-source product from NASA (worldwind.arc.nasa.gov), Virtual Earth from Microsoft (based on
Microsoft’s MapPoint technology) (virtualearth.msn.com) and Google Earth, the focus of this paper. The paper focuses particularly on how education
programs in cartography include elements that look particularly at Digital Globes and provide practical applications that allow students to explore the
potential that Digital Globes offer.
Virtual landscapes, digital globes and educational programs
Cartwright et al. (1998) addressed what should comprise a contemporary programme in cartography. They saw that a programme should have at its
core a number of key courses that provided ‘overview’ content – the ‘Holistic Thinking’ elements that were built around foundation knowledge and
professional aspects. To this were added courses in management, location and positioning, ‘production’ aspects of quality, data acquisition,
management and planning, presentational techniques and theory and practice relating to the implementation of mapping programmes. The aspect
discussed in this paper focuses on the practical elements of a contemporary program – the Multimedia Cartography program at RMIT – and how
students undertake the development of contemporary landscape visualizations
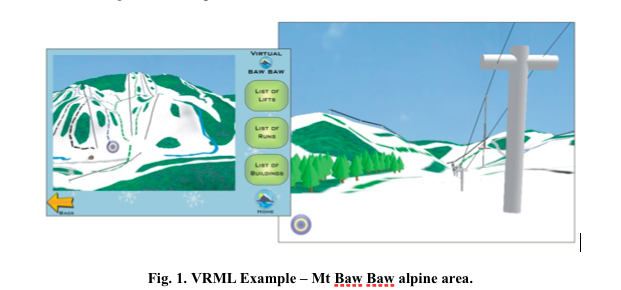
The Multimedia Cartography program in the School of Mathematical and Geospatial Sciences at RMIT University has, over the last 5-10 years, seen
students learning and experimenting with Virtual Reality Modelling Language (VRML). Studying the basics of VRML has given students an introduction
to the possibilities of 3D Geographical Visualisation. Whilst VRML did give students a solid introduction to the concept of modelling in three dimensional
space, the ‘hard coding’ nature of the practical exercises resulted in students investing a lot of time into models that, whilst fulfilling the submission
requirements fully, were often not as impressive or detailed as the students had hoped to produce.
para comunicar a criação do fórum e convidá-lo a postar e conhecer um pouco do meio cartográfico brasileiro.
Ele me respondeu com um email que continha um anexo relacionado a imagens 3D no SketchUp para visualizacao no
Google Earth
.É um artigo muito interessante, postarei aqui para que possamos compartilhá-lo entre nós cartógrafos:
Developing 3D landscape visualisations for Google Earth® with Google SketchUp
Tim Hyland and William Cartwright
RMIT University, School of Mathematical and Geospatial Science, Melbourne, Victoria
Tim Hyland and William Cartwright
RMIT University, School of Mathematical and Geospatial Science, Melbourne, Victoria
Abstract
Since its launch in 2004, Google Earth
has grown to become one of the most popular portals for spatial content on the web. The intuitive and interactive nature of the application makes it ideal for use as a learning tool for students, particularly those in
the Spatial Sciences. As well as being a medium through which to deliver virtual field trips and media-rich presentations, Google Earth
also presents itself as a blank canvas onto which students can add and edit their own content. Keyhole Markup Language (KML), the
scripting behind Google Earth
overlays and placemarks, is an easy language for students to learn and use, and can be introduced as a follow up to HTML and XML training. With training, Geospatial Science students at RMIT have been able to create packages of information,
navigable in a similar way to which users navigate through Weplb pages. With both Google Earth
and its associated 3D modelling software, Google SketchUp, available for free download, students have been given the opportunity to create their own 3D content that can be uploaded
to the web and viewed remotely. Students are able to use the same software at home as they are at the University, providing opportunities to
develop online courses and, in turn, opening the creation of web based Geo-Visualization products up to a broader audience at university level.
This paper outlines how Google SketchUp has been used in a University context to develop 3D landscape visualisations and looks at the ways
in which Multimedia Cartography students are using Google Earth
to visualise project data in ways not previously possible using traditional methods.Introduction
The aim of a virtual world display is to provide realistic and truthful sensory cues about the real world by replaying stored information or by generating
information. Laurel (1995) has said that the important thing about VR is what it does rather than how its effects are achieved - it permits people to
behave as if they were somewhere they are not. VR transports users to some other place and enhances their perceptions about what they are experiencing
by appealing to several senses at once - sight, hearing and touch. These senses are stimulated by the sensations of force, resistance and texture and it
is predicted by Laurel that smell will eventually become available, and, that as virtual spaces begin taking on a richer, more complex texture, VR will be
the foundation of a major transformation in the ethos of computing. Laurel also sees artists using VR to represent the complexities of experience from
‘synthesthesia’ to emotional experiences, leading to a situation where: “VR may function as a link from the technological manifestations of humanity back
to the world that technology has ostensibly replaced” (Laurel, 1995, p. 70).
One of the key issues for building effective landscape visualizations concerns the sensory realism that is necessary in virtual world displays. How best to
facilitate this has demanded access to and the use of various tools and software packages. These were once expensive and, sometimes, difficult to use
without extensive training and practice. Now, commercial enterprises like Google actively engage users with their visualization software like Google Earth
and provide not just the application to deliver product, but also free, or relatively inexpensive software with which to develop content.
Digital earth and Digital Globes
In an address in 1998, then US Vice-President Al Gore (1998) said: “Now we have an insatiable hunger for knowledge. Yet a great deal of data remains
unused. … part of the problem has to do with the way information is displayed.” “The tools we have most commonly used to interact with data, such as
the “desktop metaphor” employed by the Macintosh and Windows operating systems, are not really suited to this new challenge. I believe we need a
“Digital Earth”. A multi-resolution, three-dimensional representation of the planet, into which we can embed vast quantities of geo-referenced data”.
“A Digital Earth could provide a mechanism for users to navigate and search for geospatial information - and for producers to publish it. The Digital
Earth would be composed of both the "user interface" - a browsable [sic], 3D version of the planet available at various levels of resolution, a rapidly
growing universe of networked geospatial information, and the mechanisms for integrating and displaying information from multiple sources”.
Al Gore’s address on the Digital Earth (Gore 1998) provided information about how this concept might be initially applied: …“In the first stage, we should
focus on integrating the data from multiple sources that we already have. We should also connect our leading children’s museums and science museums
to high-speed networks such as the Next Generation Internet so that children can explore our planet. University researchers would be encouraged to
partner with local schools and museums to enrich the Digital Earth project — possibly by concentrating on local geospatial information.” Gore’s idea
about using the metaphor of ‘Digital Earth’ is now being realised with readily-available products from both governmental and commercial enterprises.
‘Digital Globes’ are being employed to facilitate access to and visualization of geographical information.
According to Riedl (2007), there are three types of Digital Globes:
- Virtual hyperglobes: Visualization of the digital image on a virtual globe body in virtual space;
- Tactile hyperglobes (material hyperglobes): Visualization of the digital image on a physical (touch-sensitive) globe body in real space; and
- Hologlobes: Visualization of the digital image on a virtual globe body in real space.
It is the first type of Digital Globe that this paper focuses on – Virtual hyperglobes.
Products on the market include World Wind, an open-source product from NASA (worldwind.arc.nasa.gov), Virtual Earth from Microsoft (based on
Microsoft’s MapPoint technology) (virtualearth.msn.com) and Google Earth, the focus of this paper. The paper focuses particularly on how education
programs in cartography include elements that look particularly at Digital Globes and provide practical applications that allow students to explore the
potential that Digital Globes offer.
Virtual landscapes, digital globes and educational programs
Cartwright et al. (1998) addressed what should comprise a contemporary programme in cartography. They saw that a programme should have at its
core a number of key courses that provided ‘overview’ content – the ‘Holistic Thinking’ elements that were built around foundation knowledge and
professional aspects. To this were added courses in management, location and positioning, ‘production’ aspects of quality, data acquisition,
management and planning, presentational techniques and theory and practice relating to the implementation of mapping programmes. The aspect
discussed in this paper focuses on the practical elements of a contemporary program – the Multimedia Cartography program at RMIT – and how
students undertake the development of contemporary landscape visualizations
The Multimedia Cartography program in the School of Mathematical and Geospatial Sciences at RMIT University has, over the last 5-10 years, seen
students learning and experimenting with Virtual Reality Modelling Language (VRML). Studying the basics of VRML has given students an introduction
to the possibilities of 3D Geographical Visualisation. Whilst VRML did give students a solid introduction to the concept of modelling in three dimensional
space, the ‘hard coding’ nature of the practical exercises resulted in students investing a lot of time into models that, whilst fulfilling the submission
requirements fully, were often not as impressive or detailed as the students had hoped to produce.